Root Cause Analysis Services
"In God we trust; all others must bring data."
– W. Edwards Deming
Failure analysis usually connotes the determination of how a specific part or component has failed. It is usually concerned with material selection, design, product usage, methods of production, and the mechanics of the failure within the part itself. When compared with failure analysis of a part, root cause analysis places more emphasis on the managerial aspects of failures.
The term is often associated with the analysis of system failures rather than the failure of a specific part, and how procedures and managerial techniques can be improved to prevent the problem from reoccurring.
Root cause analysis is often used in association with large systems, like manufacturing facilities, construction projects, and operations & maintenance, where there is a heavy emphasis on safety and quality assurance through formalized procedures.
The investigation into failures and root causes is imperative in the design process to have a full and complete understanding of how failures are managed to achieve success.
Without fully appreciating how close to failing a new design or process is, its designer may not fully understand how and why their design or process works.
A new design may prove to be successful because it has a large factor of safety, but that design's true factor of safety can never be known if its ultimate failure mode is unknown. Thus, the design that "succeeds" (by not failing) can actually provide less reliable information about that design than one that failed and revealed its weakness. It is this observation that has long motivated better designers to study failures more than successes.
Our engineers have decades of experience with failure analyses and identifying the root cause and contributing factors of those failures. These failure analyses have proven worthwhile to identify shortcomings in design and identify improvements.
These analyses leverage our Design and Materials & Processes knowledgebase and form the backbone of our forensic engineering services.
Our most-common root cause analysis tools

Pareto Analysis
Pareto charts are based on Pareto's law, also called the 80/20 rule, which says that 20% of inputs drive 80% of results. Here, we analyze and determine the heavy hitters in the process failure history to identify where the best opportunities for improvement reside
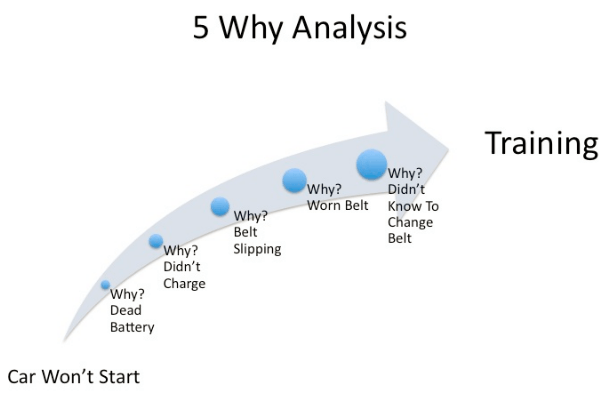
The 5 Whys
The 5 Whys is a method that uses a series of "why?" questions to drill down into successive layers of a problem. The basic idea is that each time one asks why, the answer becomes the basis of the next why. It's a simple cost-effective tool useful for easier problems where advanced statistics isn't necessary.

Ishikawa Diagram
The Ishikawa (or fishbone) diagram sorts possible causes into various categories that branch off from the original problem. This diagram may have multiple sub-causes branching off of each identified category. The categories most used are the 6Ms: manpower, method, machine, material, milieu, and measurement.
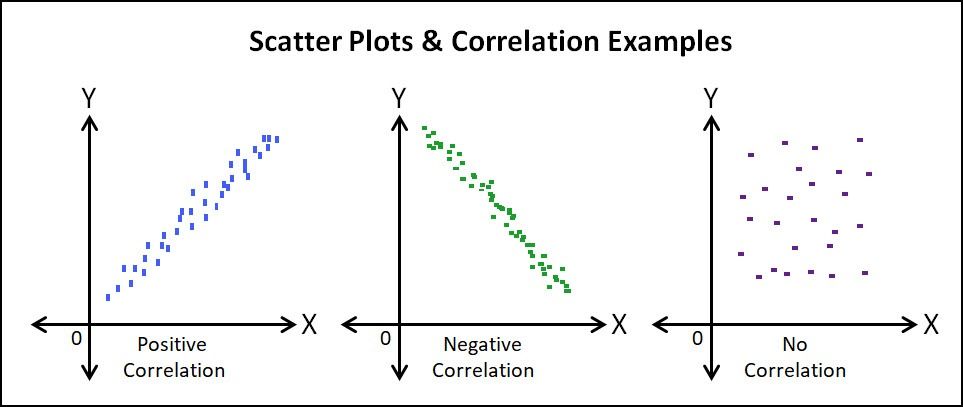
Scatter Diagram
A scatter plot or scatter diagram uses pairs of data points to help uncover relationships between variables. A scatter plot is a quantitative method for determining whether two variables are correlated, such as testing potential causes identified in the Ishikawa diagram.
Making a scatter diagram is as simple as plotting your independent variable (or suspected cause) on the x-axis, and your dependent variable (the effect) on the y-axis. If the pattern shows a clear line or curve, you know the variables are correlated and you can proceed to regression or correlation analysis.
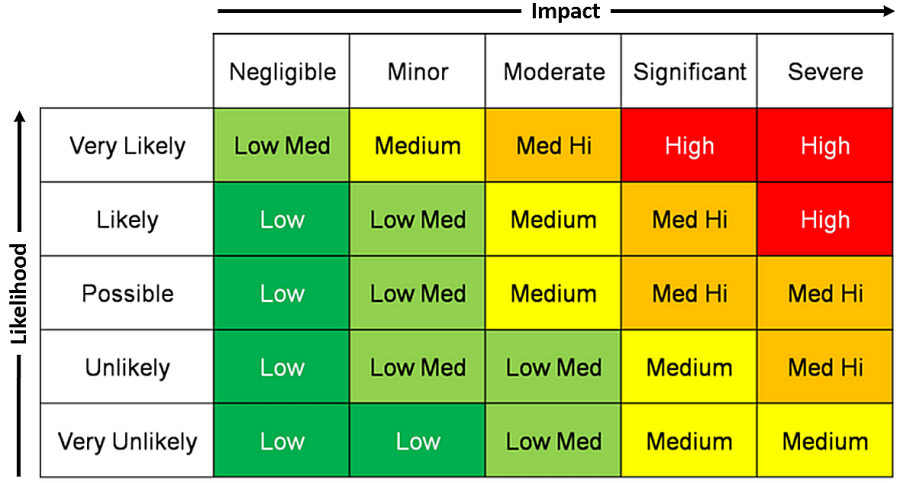
Failure Mode and Effects Analysis (FMEA)
Failure mode and effects analysis (FMEA) is a formal method used during product or process design to explore potential defects or failures. An FMEA chart outlines:
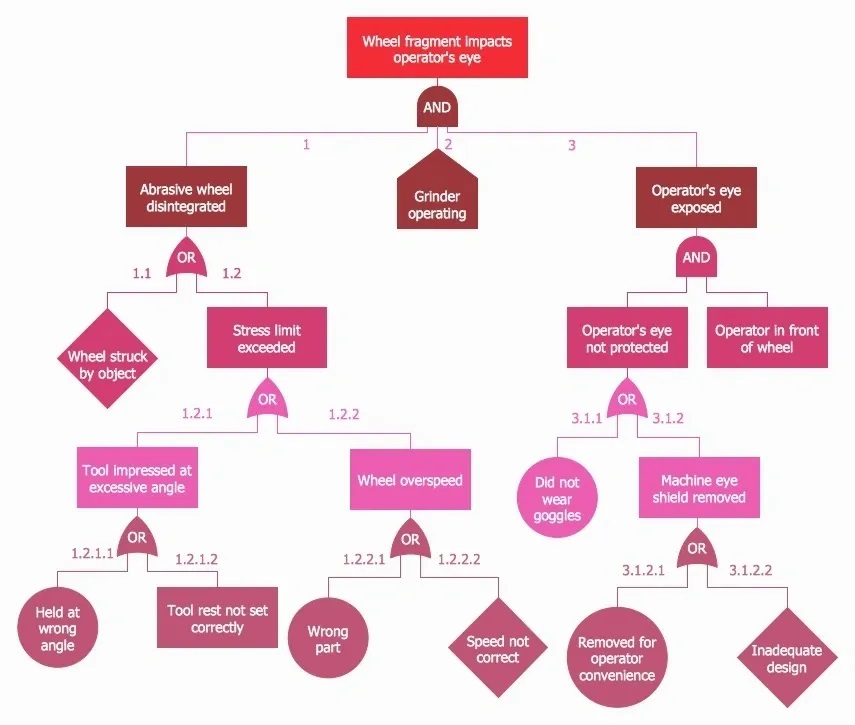
Fault Tree Analysis
Corrective Action
No matter which tool is used, the result of the root cause analysis is just the beginning of our problem-solving process. The next step is tapping into our Design and M&P services and experience to implement corrective and preventative actions (CAPAs) that are then monitored for success.
Alternatively, this root cause analysis can be used to formulate a working hypothesis for our Forensic Engineering services where we work with out legal clients to formulate litigation strategy
© 2025, Gordon & Gordon Engineering. All Rights Reserved.